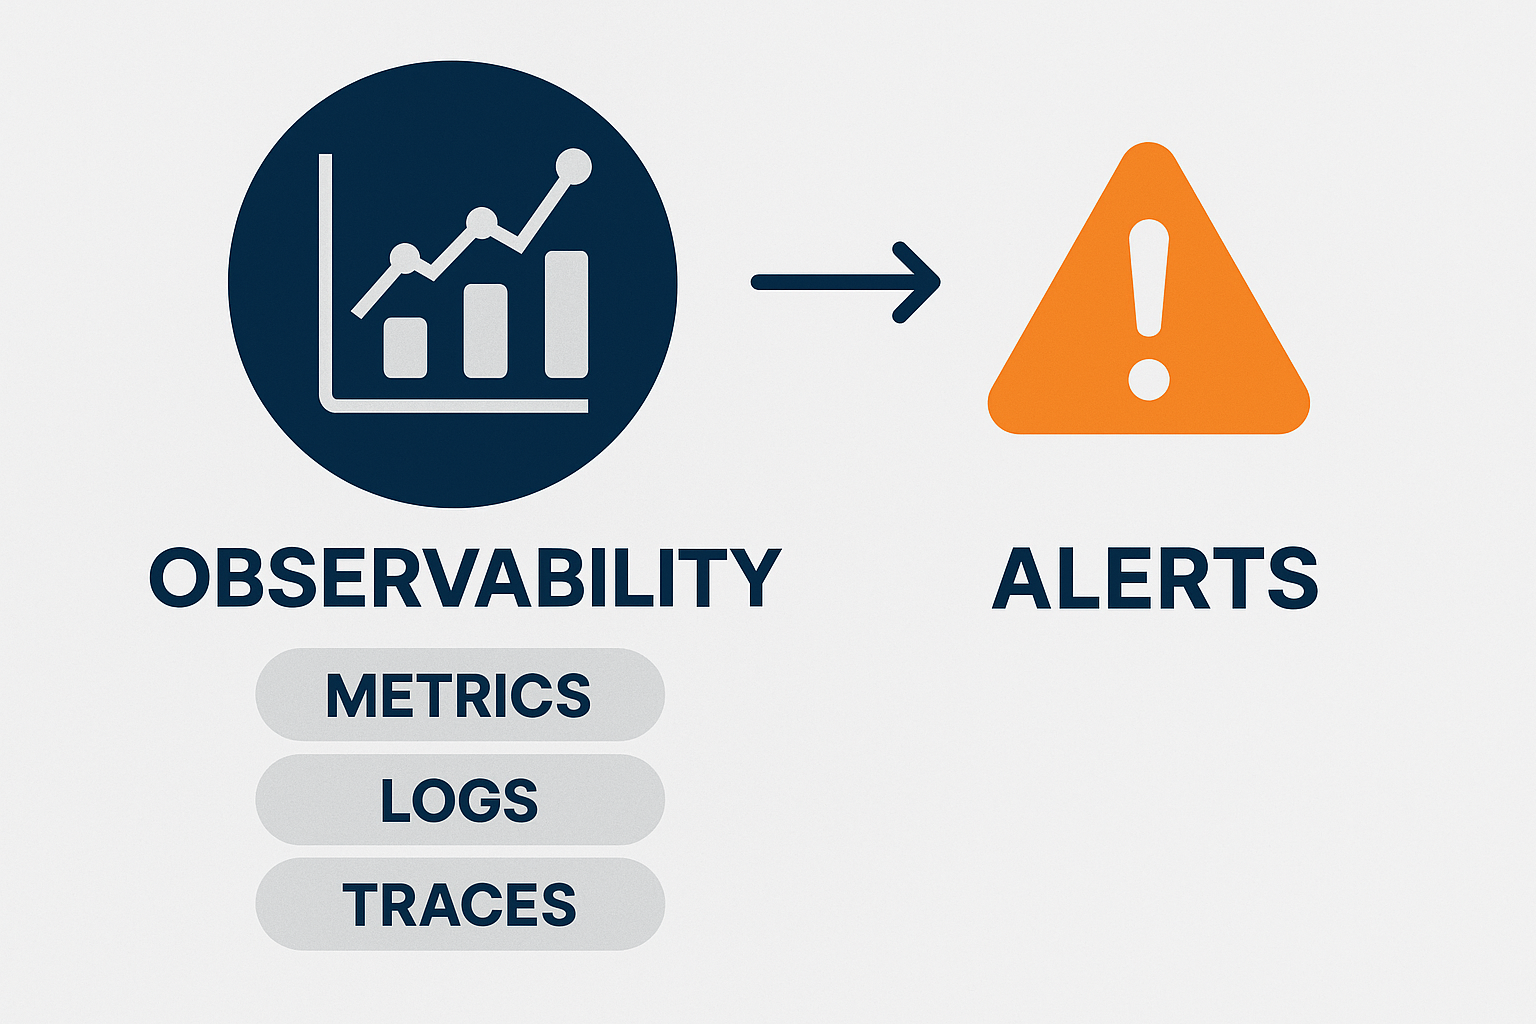
Monitoring and Alerts in Distributed Systems
Introduction
Modern distributed systems power mission-critical applications at scale. While building scalable services is essential, keeping them observable and reliable is equally important. Monitoring and alerts form the nervous system of infrastructure — enabling engineers to detect failures, measure performance, and take corrective action before users notice.
This article covers:
- The pillars of observability (metrics, logs, traces).
- How to design an alerting pipeline.
- Trade-offs in alerting strategies.
- A practical example of Elasticsearch + Lambda alerting.
- Key insights for FAANG interviews.
Why Monitoring and Alerts Matter
- Uptime Guarantees: FAANG-scale systems must meet 99.9%+ SLAs.
- Early Detection: Alerts identify anomalies before they become outages.
- Capacity Planning: Metrics guide scaling and cost optimization.
- Postmortems: Logs and traces provide evidence for root-cause analysis.
- Interview Relevance: Candidates are often asked, “How would you monitor this system?”
Think of monitoring as the eyes and ears of your system, and alerts as the reflexes that trigger when something goes wrong.

Pillars of Observability
1. Metrics
- Definition: Quantitative time-series measurements (e.g., latency, CPU usage).
- Types:
- Counter: Ever-increasing values (e.g., number of requests).
- Gauge: Current state values (e.g., CPU %, memory usage).
- Histogram: Distribution (e.g., request latency p95, p99).
- Tools: Prometheus, CloudWatch, Datadog.
- Interview Tip: Always mention “latency, throughput, error rates” (the golden signals).
2. Logs
- Definition: Immutable, append-only event records.
- Types:
- Structured logs: JSON for machine parsing.
- Unstructured logs: Text for humans.
- Tools: Elasticsearch, Splunk, Cloud Logging.
- Design Note: Centralize logs with correlation IDs for cross-service debugging.
3. Traces
- Definition: End-to-end request tracking across services.
- Key Concepts: Span, trace ID, parent-child relationships.
- Tools: Jaeger, Zipkin, OpenTelemetry.
- Use Case: Debugging microservices latency bottlenecks.
Designing an Alerting Pipeline
A monitoring system must collect, analyze, and act:
Collection
- Agents (e.g., Prometheus Node Exporter, Fluentd) gather metrics/logs.
- Distributed tracing libraries instrument services.
Aggregation & Storage
- Centralized systems (Prometheus, Elasticsearch, CloudWatch) store data.
Analysis
- Rules/queries identify anomalies (e.g., “p95 latency > 500ms for 5 minutes”).
Alerting
- Tools (PagerDuty, Opsgenie, CloudWatch Alarms) trigger alerts.
- Alerts should be actionable, not noisy.
Visualization
- Dashboards (Grafana, Kibana) display metrics in real time.
Practical Example: Elasticsearch + Lambda Alerts
A lightweight alerting pipeline:
- Collect Logs: Application logs are shipped to Elasticsearch.
- Define Query: E.g., search for “status:500” errors.
- Trigger Lambda: A CloudWatch event triggers a Lambda function every minute.
- Lambda Checks Logs: Runs the query, counts recent 500 errors.
- Send Alert: If threshold exceeded, Lambda sends a Slack/Email alert.
# Lambda snippet to query Elasticsearch for error logs
import requests, os, smtplib

ES_ENDPOINT = os.getenv("ES_ENDPOINT")
THRESHOLD = 20

def lambda_handler(event, context):
    query = {
        "query": {"match": {"status": "500"}},
        "size": 0,
        "aggs": {"error_count": {"value_count": {"field": "status"}}}
    }
    res = requests.post(f"{ES_ENDPOINT}/logs/_search", json=query).json()
    count = res["aggregations"]["error_count"]["value"]

    if count > THRESHOLD:
        send_alert(f"High error rate: {count} 500s in last minute")

def send_alert(msg):
    print("ALERT:", msg)
# Could integrate with SES, Slack API, PagerDuty- Edge Cases: Prevent duplicate alerts by grouping.
- Trade-Offs: Simple, cost-effective, but limited vs. full systems like Datadog.
Alerting Best Practices
- Alert Fatigue: Too many alerts = ignored alerts. Tune thresholds.
- Severity Levels:
- Critical: Pager duty (site outage).
- Warning: Email/Slack (degraded performance).
- Info: Dashboard only.
- SLIs/SLOs: Define metrics that map to user experience (latency, error rate).
- Runbooks: Every alert should link to troubleshooting steps.
Real-World Context & FAANG Relevance
- Amazon: Obsessed with operational excellence → expect questions like “How do you monitor S3?”
- Google: SRE principles — SLI, SLO, SLA language is expected.
- Meta: Focus on speed & incident response efficiency.
- Netflix: Chaos engineering ensures monitoring catches failures.
Interview Tip: Practice saying —
“I’d monitor latency, throughput, and error rates, centralize logs with correlation IDs, and set up SLO-based alerts with automated runbooks.”
Practice Exercise
Problem: Design monitoring + alerting for a video streaming service.
- Metrics: request latency, error rate, bandwidth usage.
- Logs: structured logs with user/session IDs.
- Traces: request flow across microservices.
- Alerts:
- Critical: “Error rate > 5% for 5 minutes” → PagerDuty.
- Warning: “p95 latency > 400ms” → Slack.
- Info: “Cache hit ratio < 80%” → dashboard only.
STAR Response (Google):
- Situation: Service latency spiked during peak traffic.
- Task: Detect and resolve quickly.
- Action: Set up SLO-based alerting in Prometheus + Grafana.
- Result: Reduced MTTR by 60%, ensuring 99.9% uptime.
Conclusion
Monitoring and alerts transform reactive firefighting into proactive resilience. Mastering these patterns is essential for FAANG interviews and real-world engineering.
Next: Explore GPU and AI Infra or revisit all sections.